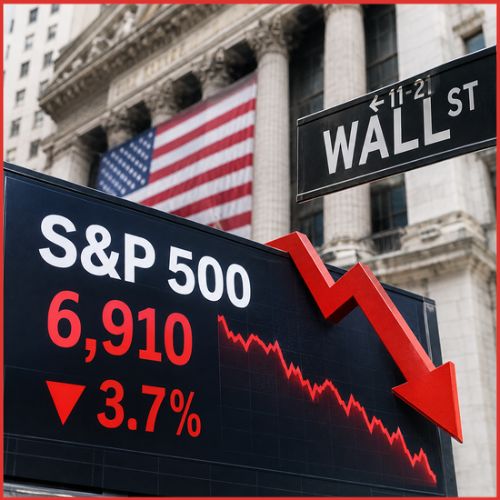
The S&P 500 entered correction territory on November 20, closing at 6,910 after a seventh consecutive losing session as selling in technology shares continued to weigh on Wall Street.
The index finished more than 10% below its October high of 7,818. Calculated from those rounded figures, the decline was approximately 11.6%.
BigGo Finance reported that the Dow Jones Industrial Average had also entered correction territory. The weakness persisted despite Nvidia’s earnings and Anthropic’s stock-market debut, developments that had failed to restore sustained buying.
The result marked a difficult end to a week in which investors became less willing to accept the valuations attached to the AI trade.
The Final Session Deepens The Decline
The S&P 500 fell approximately 3.7% on Friday, while the Nasdaq Composite lost about 5.3%.
TheStreet’s market review described the S&P’s seven-session losing streak as its longest since February 2020. It also reported an 8.6% weekly decline for the benchmark.
Those figures show two different dimensions of the sell-off: persistent daily weakness and a particularly sharp final session.
A losing streak does not, by itself, reveal the size of the damage. Seven small declines can produce a different outcome from a sequence containing several large moves.
In this case, the fall from the October high supplied the more consequential milestone. It placed the benchmark beyond the threshold commonly described as a correction.
Correction Territory Describes The Fall, Not What Comes Next
A correction generally refers to a decline of at least 10% from a recent high.
It describes the price movement already recorded. It does not establish how long the decline will last or whether another fall will follow.
That distinction matters because market labels can sound more predictive than they are.
The same threshold can be reached under different economic and financial conditions. The label alone does not identify the cause, measure company fundamentals or provide a reliable recovery timetable.
For investors, the useful question is what changed in expected earnings, financing conditions or willingness to pay for future growth.
The threshold attracts attention. The underlying reasons require closer examination.
AI Expectations Face A Harder Test
The AI stock sell-off has brought the relationship between technological progress and investment returns into focus.
A company can report growing demand while its shares fall if investors had expected still more, or if they become less comfortable with the price already assigned to that growth.
The same applies to spending.
Large infrastructure commitments may support future products, but they also create questions about when revenue and cash generation will justify the investment.
Recent market commentary has highlighted those concerns alongside expectations about US interest rates.
That does not establish that AI demand has disappeared. It indicates that investors are examining the financial consequences more critically.
A promising technology and a well-priced stock are separate propositions.
Positive Company News Did Not Lift The Whole Market
Nvidia’s earnings and Anthropic’s IPO were unable to reverse the broader decline, according to the linked report.
An earnings release may support confidence in one business without resolving concerns about the valuation of an entire sector.
Likewise, a successful listing can attract substantial interest while existing shares elsewhere continue to fall.
The market does not need to reach one consistent judgement about every AI company. Investors can favour a particular new issue, reduce exposure to another business and remain cautious about the benchmark.
A headline event therefore cannot be assumed to provide support across the whole market.
Concentration Can Magnify A Shift In Sentiment
When a relatively small group of companies contributes heavily to an index’s advance, a reversal in those companies can have an outsized effect.
That does not mean every constituent experienced an identical decline.
An index combines many businesses with different earnings drivers. Its headline movement can obscure those differences.
For someone holding a broad fund, the relevant exposure depends on the weights within it. Owning many securities does not necessarily mean each has an equal influence on returns.
This becomes more visible during a concentrated sell-off.
The practical lesson is to examine what a portfolio owns rather than rely entirely on the number of holdings or the breadth suggested by its name.
A Steep Fall Changes The Arithmetic Of Recovery
The move from 7,818 to 6,910 represents a loss of 908 index points.
Returning from 6,910 to 7,818 would require a gain of approximately 13.1%, calculated from those rounded levels.
That recovery percentage is larger than the percentage decline because it begins from a lower base.
A strong positive session can recover part of a loss without returning the index to its earlier high.
It also helps explain why performance should be measured over a defined period.
A daily rebound, a weekly result and the distance from a record are different comparisons. Each can be accurate while telling a different part of the story.
The Next Phase Requires Evidence Beyond A Bounce
After a sharp decline, attention often turns quickly to whether prices have fallen far enough.
That cannot be settled by the size of the loss alone.
A more durable improvement would require investors to regain confidence in the relationship between valuations and business performance.
Company results, spending plans and financing conditions will provide evidence for that assessment.
A brief rally would show renewed buying at particular prices. It would not automatically resolve the concerns behind the correction.
For now, the Wall Street correction has extended beyond a few weak sessions, with the S&P 500 closing well below its October peak.
The next market move will matter, but the more important question is whether the financial expectations supporting the earlier rally can withstand closer scrutiny.